Evaluating a trained network
To determine if the network has a sufficient accuracy, we can evaluate the performance based on different metrics for the total results (all classes) and each individual class.
ℹ️ Note: The evaluation process for instance segmentation is very similar to object detection. The main differences are in how the annotations are shown because instance segmentation uses pixel masks instead of bounding boxes.
- A Missed object means that the object was not identified at all by the network (7 objects in this evaluation).
- An Incorrect object means that the object was identified but given the wrong class, (e.g. a brown vial predicted as a green vial) or detected in the wrong location (6 objects in this evaluation).
- Correct means that the object was identified and predicted to have the correct class, e.g. a brown vial predicted as a brown vial (66 objects in this evaluation).
How do I interpret the Evaluate tab?
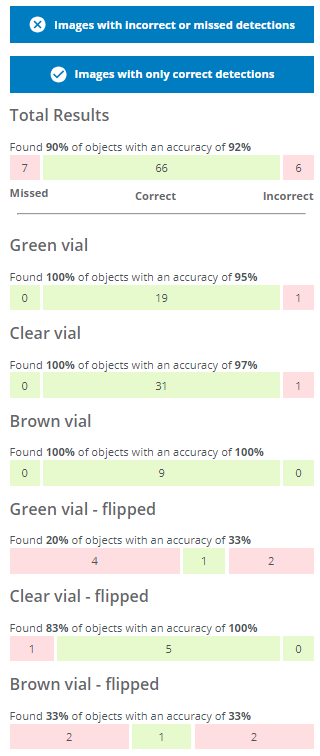
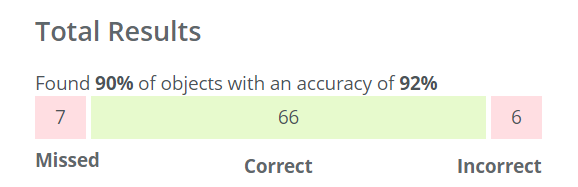
In this evaluation, 7 objects were missed, 6 were assigned to the incorrect class and 66 objects were detected and predicted to have the correct class.
Things to consider for your application
- What is most important to me - the overall accuracy, or the accuracy of one/some of the classes?
- Are incorrect class predictions okay for some objects? Eg. would flipped green vials incorrectly predicted as flipped brown or flipped clear be acceptable, but not any flipped vials predicted as normal standing vials?
- Are missed predictions (objects not detected at all) a bigger issue than incorrect predictions (object found but predicted with the wrong class)?
Total results
You can display images with incorrect or missed detections as well as images with only correct predictions by pressing the corresponding blue buttons. You can see the details of the predictions by clicking on one of the images.
- A bounding box/pixel mask with a dashed line and a red cross icon at the top left represents a missed object.
- A bounding box/pixel mask with a solid line and a red cross icon at the top left represents an object predicted with the wrong class or detected in the wrong location.
- A bounding box/pixel mask with a solid line and a green checkmark icon at the top left represents an object with the correct class in the correct location.
- The different colors of the bounding box represents the different classes as you defined them during the Domain creation.

I've changed the colors of classes but those are not updated in the evaluation
If you have changed the class colors after starting a training, the old colors will be used. You can start a new training to have the updated colors.The total number of found objects are calculated as 66 objects found out of 66+7 which means 66 / (66 + 7) ≈ 90%. The total accuracy is calculated as the number of correctly predicted objects (66) out of the total number of detected objects (66+6) which means 66 / (66 + 6) ≈ 92%.
Detailed segmentation example
- Each segmented instance is highlighted with a color based on its class, making it easy to identify individual objects even in crowded scenes.
- The color legend includes a useful “Click to hide” button - simply click on any class to hide all the pixel masks of that class. This can be helpful to reduce visual clutter for easier analysis of the model performance.
- The Hide icons and Show icons button lets you easily show or hide the checkmark and cross icons.
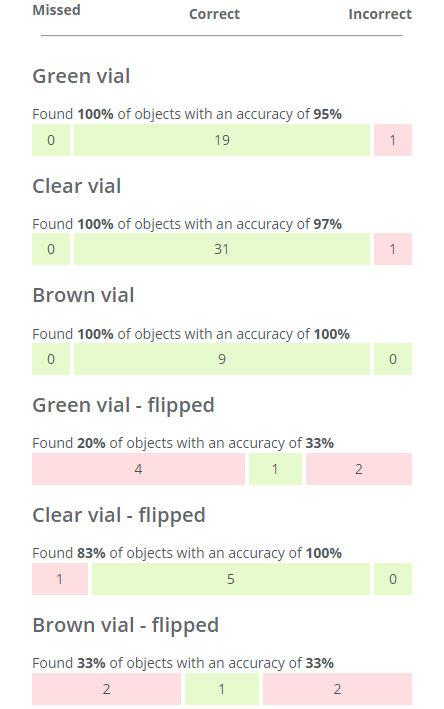
Results for individual classes
- The number of found objects and the accuracy of each class is calculated similarly as for the total result, but for each individual class.
- You can see example images of missed objects and correct and incorrect predictions by clicking on the different bars. You can then also click on individual images for details.
- Please note that if you click on the Correct bar for an individual class (eg. Green vial), some or all of the displayed images may be marked with a red cross icon. This means that even if all the Green vials were correctly found and predicted in the image, objects of some other class might be incorrectly predicted or missed. In the example below, the two Green vial were found, but the flipped brown vial was missed.
- Please note that if you click on the Correct bar for an individual class (eg. Green vial), some or all of the displayed images may be marked with a red cross icon. This means that even if all the Green vials were correctly found and predicted in the image, objects of some other class might be incorrectly predicted or missed. In the example below, the two Green vial were found, but the flipped brown vial was missed.
How can I improve the next network based on the evaluation results?
The total results as well as the results for the individual classes are too poor to solve my application. I need to add and annotate more images, and then train a new network.
- None of the objects in the Green vial and Clear vial classes were missed and the accuracy of these classes are fairly high.
- Action: I only need to add a few more example images containing Green and Clear vials. Clear vials have the most (31) so a total of around 35 might be sufficient.
- The Brown vial class is all green but I can also see that it only contains nine objects, so it might just be luck that the results were good.
- Action: I need to add more images containing Brown vials. I want to have roughly the same amount of objects per class (see Good practices for collecting images), so adding 35 - 9 = 26 objects is a good start.
- The flipped classes have many missed objects and lower accuracies as well as few objects.
- Action: I need to add more images containing "Green vial - flipped", "Clear vial - flipped" and "Brown vial" flipped, ≈30 objects per class.