Training in dStudio
Create a project in order to start a training. Click the "Create Project" button on the Data snapshot you would like to use for the training. This will take you to the Project setup, where you define the training settings.
Select settings
Settings available for anomaly detection networks are:
Network depth
Choose between small and medium network depth. The small networks are faster and are best for low complexity concepts, while the medium networks are slower but can handle more abstract concepts and in general usually have a higher accuracy.
Augmentations
Currently only two options are available: enabled and disabled. If enabled, training images will have random 90deg rotations and mirroring.
Input resolution
Choose between 32x32, 64x64, 128x128 256x256, 320x320, 480x480, and 640x640. As opposed to Classification and Object Finding, the Anomaly Detection network sizes sizes are only approximations of the actual input size: the network will get an input size that is close the selected area rather than exact dimensions, while trying to respect the aspect ratio of the original images. The input resolution is a tradeoff between speed and accuracy. The higher the resolution, the slower the training and inference will be, but usually the accuracy will be higher. A rule of thumb here is to choose a higher resolution if the anomalies are small and a lower resolution if the anomalies are large.
Start the training
Once you have selected the settings, click the "Next" button. You will be prompted for a project name. Name it something that makes the project easy to distinguish from others in the future and click the "Create Project" button. The training will start and you will be redirected to the project overview page where you can see the training progress.
You will get two feedback graphs during the training: Score distribution and Accuracy. Both of these are evaluated on the validation set, which is a subset of the training images that are not used for training in this step.
The validation set
The data you provide is automatically split into a training (~80%) and validation (~20%) set. The validation set is used to evaluate the performance of the network during training and in the evaluation tab. In the first stage, the network is only trained on the training set. The evaluation displayed in dStudio is done with a version of the network that has never seen the validation data. After the evaluation is generated however, a final training stage is run where the network is trained on all data in your snapshot. This leads to a final network that performs slightly better, but might mean that the score for a given image when running on device might not be exactly the same as in the evaluation in dStudio, which can be relevant to keep in mind if evaluating the network manually later on.Score distribution
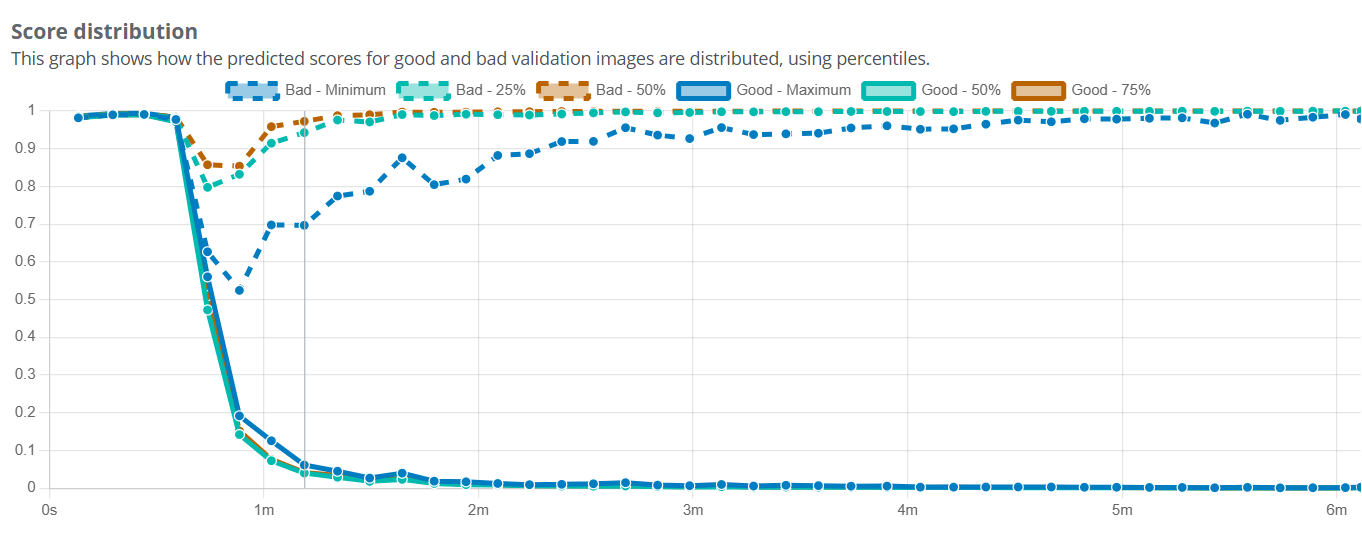
The score distribution graph shows the distribution of anomaly scores for the training images. A well-trained model will have high scores for Bad images, and low scores for Good images. Through this graph, you can see how the scores of the different classes trend. If the Good and Bad lines are not separating over the course of the training, it may indicate that the model is not learning to distinguish between normal and anomalous images effectively. In the ideal case there is a clear and stable separation between the classes, which can be seen by the "Good - maximum" line being below the "Bad - minimum" line. This means that the highest score of any of the Good images is lower than the minimum score of any of the Bad images. This means the network is able to distinguish between Good and Bad images with 100% accuracy on the validation set.
If the Minimum and Maximum lines are crossing, the other lines in the graph can help you understand how the training is generally performing. The line Good - 75% can be interpreted as "75% of the Good images have a score below this line". Correspondingly, the line Bad - 25% means "25% of the Bad images have a score below this line". Since we want the scores to be high for Bad images, these two lines are each others counterparts for the Good and Bad classes. The same goes for the 50%-lines. If these lines are still clearly separated it means that the network performs well on a majority of the images, which might mean that there are a few outliers that the network struggles with. In this case, further looking into which images are hard for the network in the following Evaluation step can help you find, for example, which type of anomaly you might need to add more examples of in your training data.
Accuracy
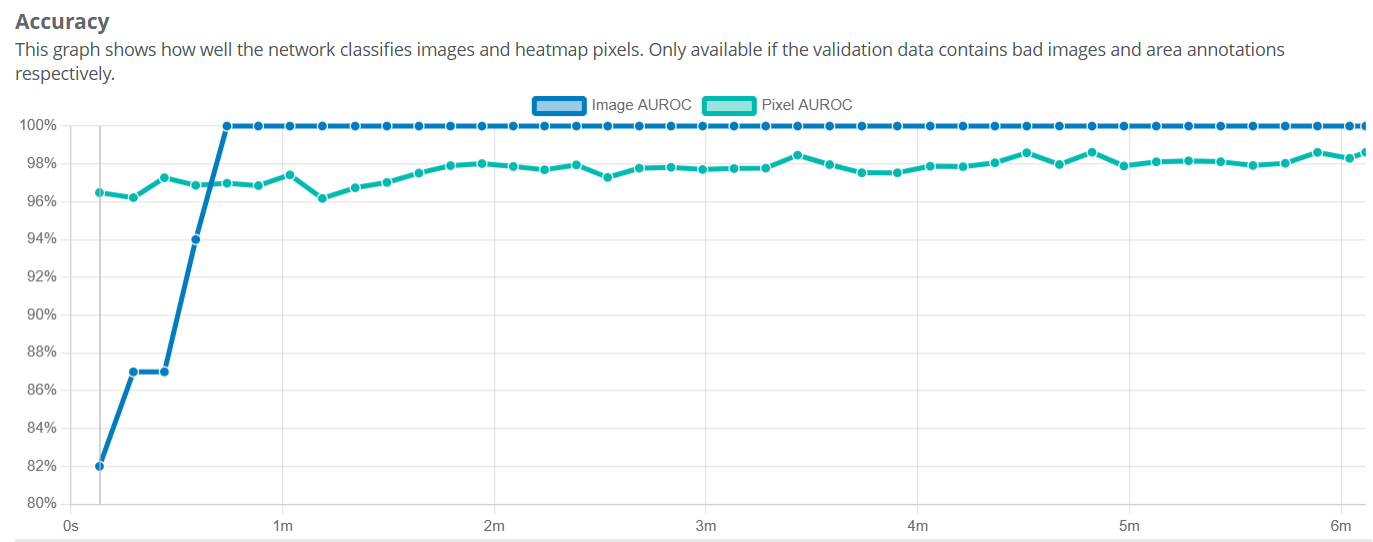
The graphs shows the Image-level AUROC and Pixel-level AUROC accuracy measures. The Image-level AUROC measures how well the model can distinguish between good and bad images, while the Pixel-level AUROC measures how well the model can localize the anomalies within the images. A higher AUROC value indicates better performance. Pixel-level AUROC is only available if you have annotated the anomalies on a pixel level.